
Top takeaways from February:
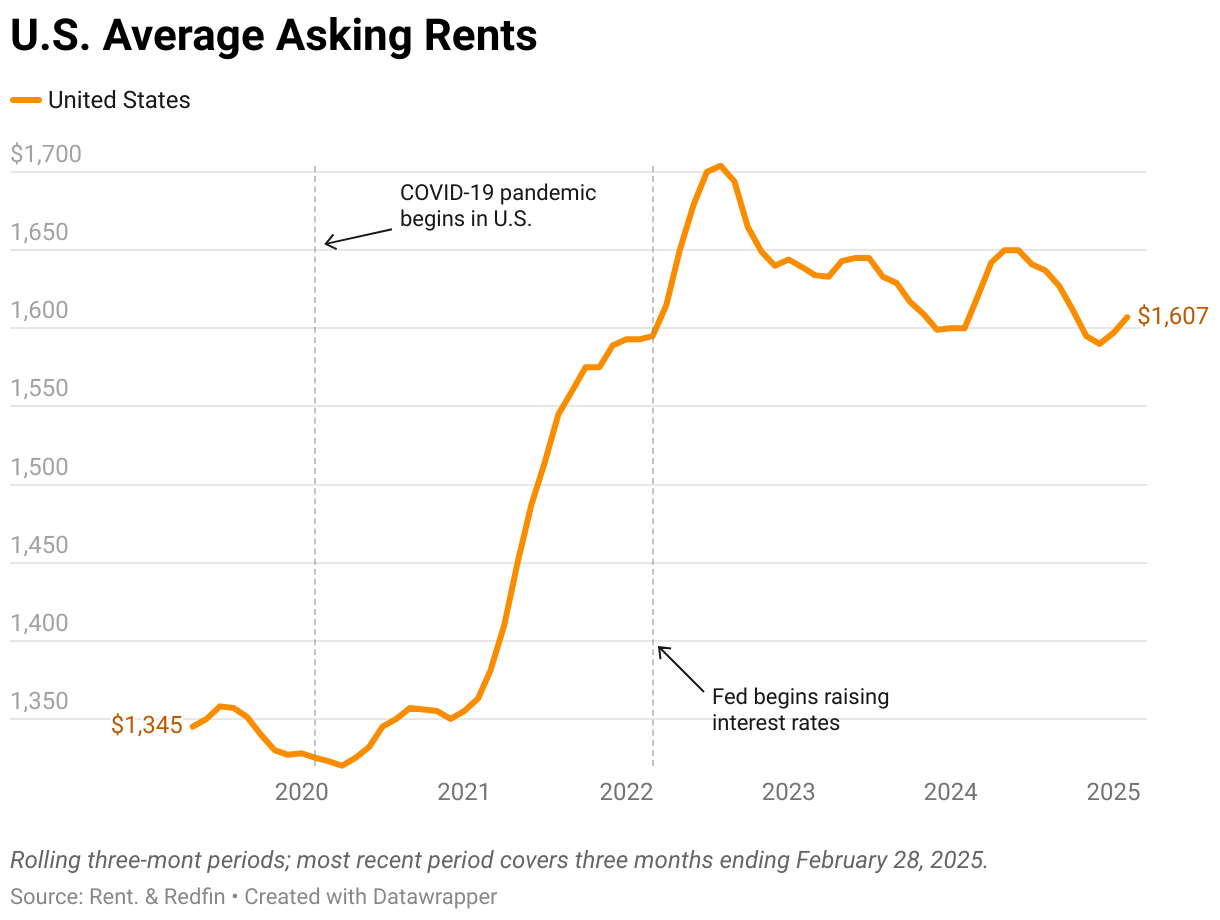
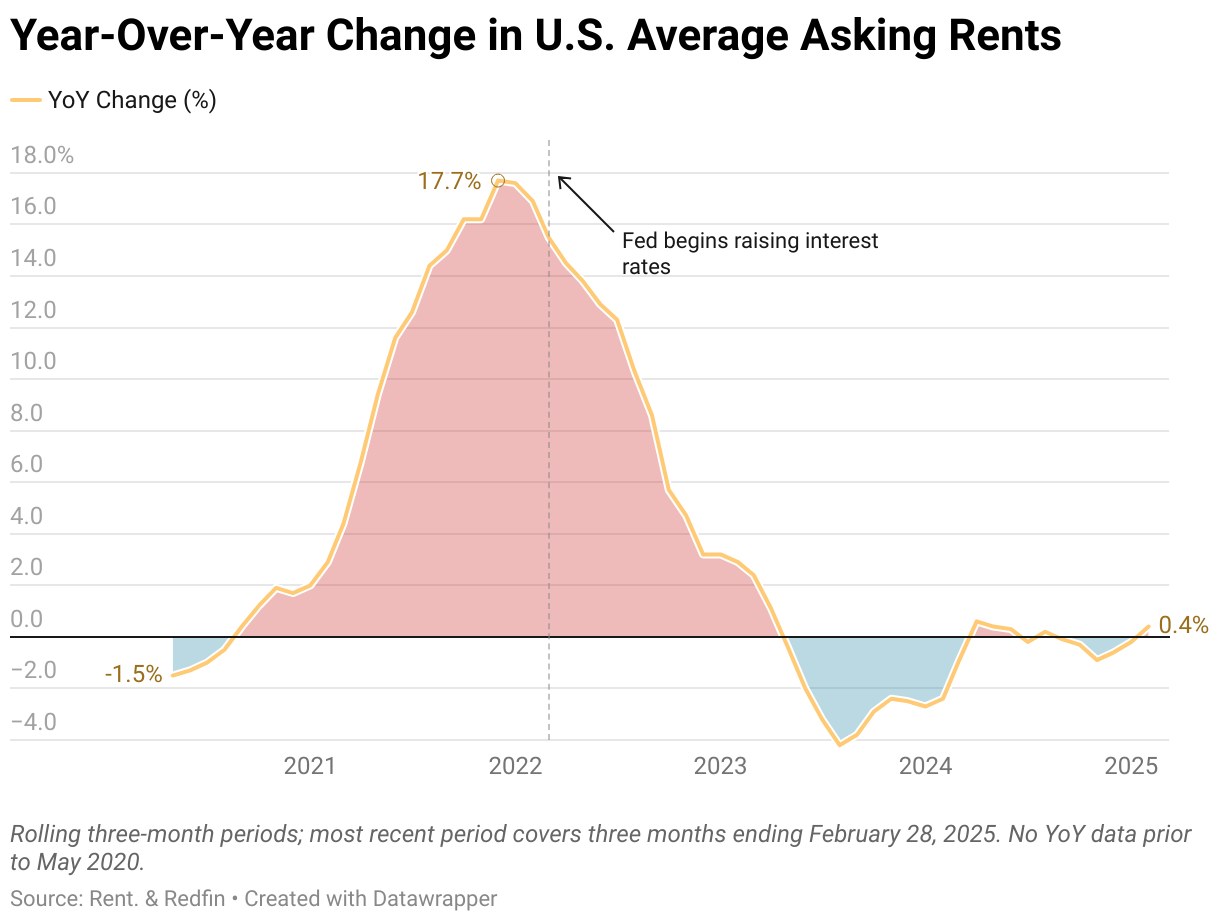
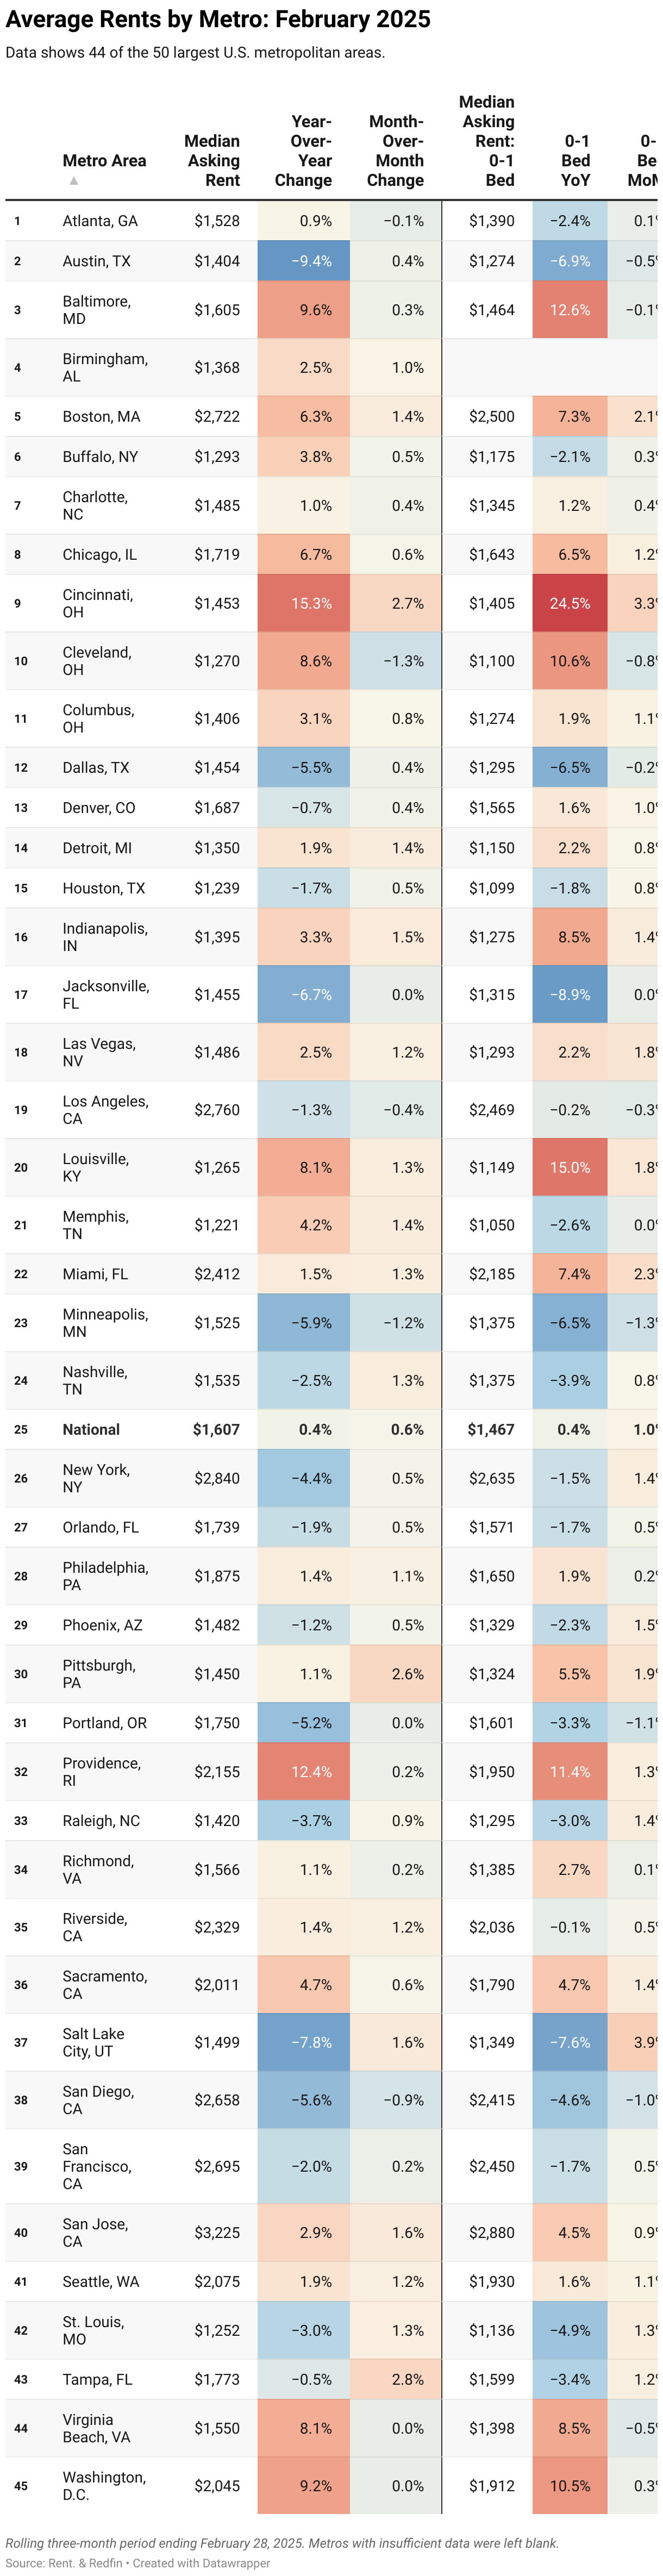
- The U.S. asking rent rose 0.4% year over year in February to $1,607.
- On a monthly basis, rents rose 0.6% ($10), up from $1,597 in January.
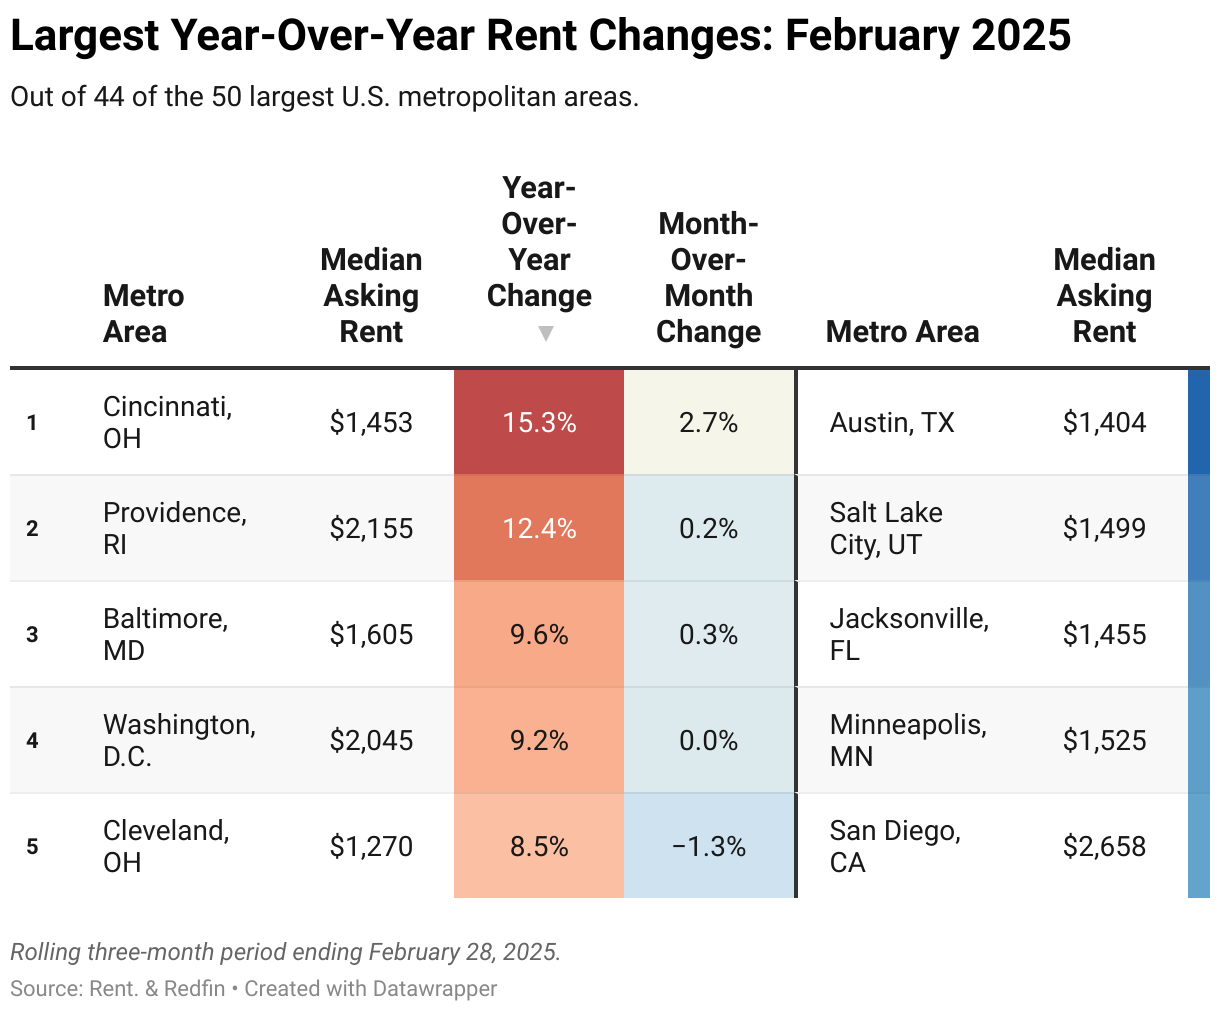
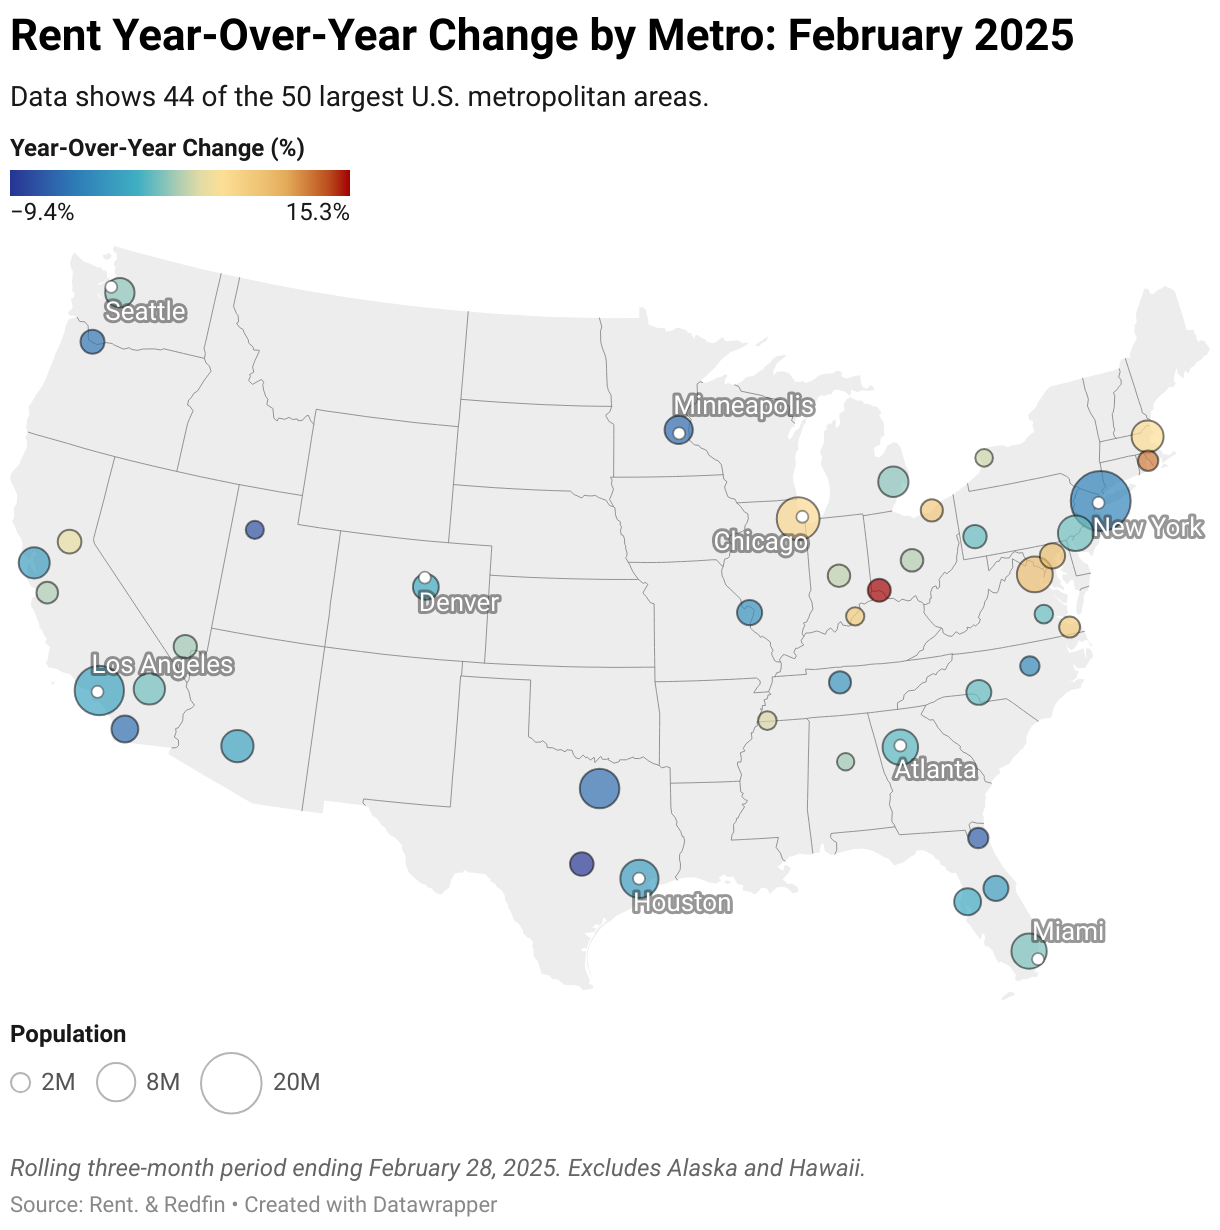
- Cincinnati, Providence, and Baltimore saw the biggest rent increases; Austin, Salt Lake City, and Jacksonville posted the biggest declines.
- 2025 continues to be a renter’s market: Apartments are coming online at record levels, keeping rents relatively steady and widening the affordability gap between buying and renting.
Average U.S. rental trends
The average rent rose 0.4% year over year in February to $1,607 – the first gain in six months. On a monthly basis, rent prices rose by 0.6% ($10). The price per square foot of an apartment, which has hovered around $1.80 for over a year, fell 0.4% compared to February 2024.
Rents have remained calm so far this year – a welcome respite for renters. Prices have held somewhat steady for over two years, following aggressive growth in 2021 and 2022. Even so, rents are just 5.6% below their record high of $1,704 set in August 2022.

However, these trends could be in the early stages of shifting. New apartment construction has dropped since late 2024 – largely because so many units are still coming online – and may be further hampered by a range of new tariffs. Demand for rentals may also continue to grow as high house prices and unstable mortgage rates push homeownership out of reach for more people. Rents may rise substantially if demand starts to outpace supply.
For now, though, rents are unlikely to post major year-over-year gains.

What today’s rent prices mean for renters
Renters can afford more space than they could a year ago because although rents haven’t changed much, incomes have gone up. However, over the past five years, housing costs have far outpaced wages.
The wage needed to afford the typical apartment recently dropped to $63,680 – the lowest level in nearly three years. Aside from this month, affordability has improved recently thanks to the surge of apartments hitting the market. More apartments means more supply, which helps offset demand and keep prices in check. Vacancy rates are also at three-year highs, and new apartments are cheaper than they’ve been in over two years (because they’re filling up slowly). Plus, fewer renters are moving than ever, meaning renters may face less competition for a unit.
Another important factor: Nearly half of the 50 largest U.S. metros have seen a rise in wealthy renters since 2019, with those in the Sun Belt and Rust Belt posting the largest gains. In Pittsburgh, a renter with an income in the top 20% locally earns more than four times what they need to afford a median-priced home.
Rental trends by bedroom type
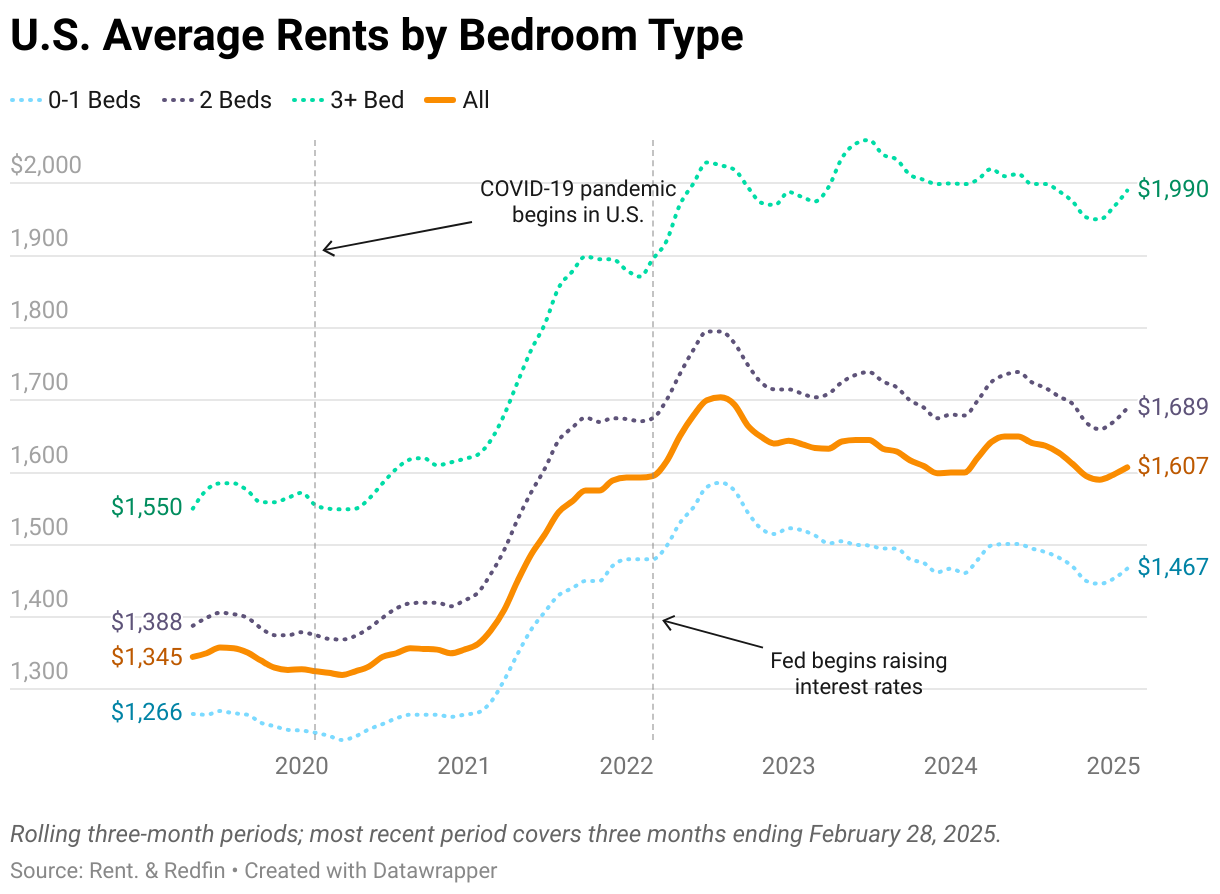
Rents rose for 0-1-bed and 2-bed apartments for the first time since June 2024. Asking rents for 3+-bedroom apartments dropped less than 1%.
- Rents for 0-1-bedroom apartments rose 0.4% YoY to $1,467
- Rents for 2-bedroom apartments rose 0.6% YoY to $1,689
- Rents for 3+-bedroom apartments fell 0.5% YoY to $1,990

Metros with the biggest rent increases and decreases

Rents keep climbing in the Midwest
Many historically affordable Midwest and East Coast metros are seeing steady rent growth, primarily because they haven’t built as many new apartments. This supply/demand imbalance has helped drive rents higher. Cincinnati and Providence saw the largest rent increases in February.
Washington, D.C. and Providence are unique because rents aren’t particularly affordable, but they’re still rising because construction hasn’t kept up with strong demand in recent years. Demand for lower-priced rentals is especially high. In Providence, renters moving from Massachusetts are a major driver.
Prices drop steeply in the Sun Belt
In many Sun Belt cities, new apartments continue hitting the market at a fast clip to meet the pandemic-era relocation boom, boosting supply and bringing down rents. This has prompted some property managers to offer rent concessions (free parking, free month of rent, etc) to attract tenants. Rents are falling quickest in Florida and Texas metros where this is most pronounced, like Jacksonville and Austin.
Additionally, many southern states are grappling with intensifying natural disasters, making an already-falling share of residents hesitant to live there.
Austin again topped the list of the largest rent decreases, continuing its steep decline from post-pandemic highs. Rents are 22% below their August 2023 record high. As people continue moving out, apartment supply outweighs demand, with some saying the rental market is “collapsing.”
Year-over-year rent changes by metro

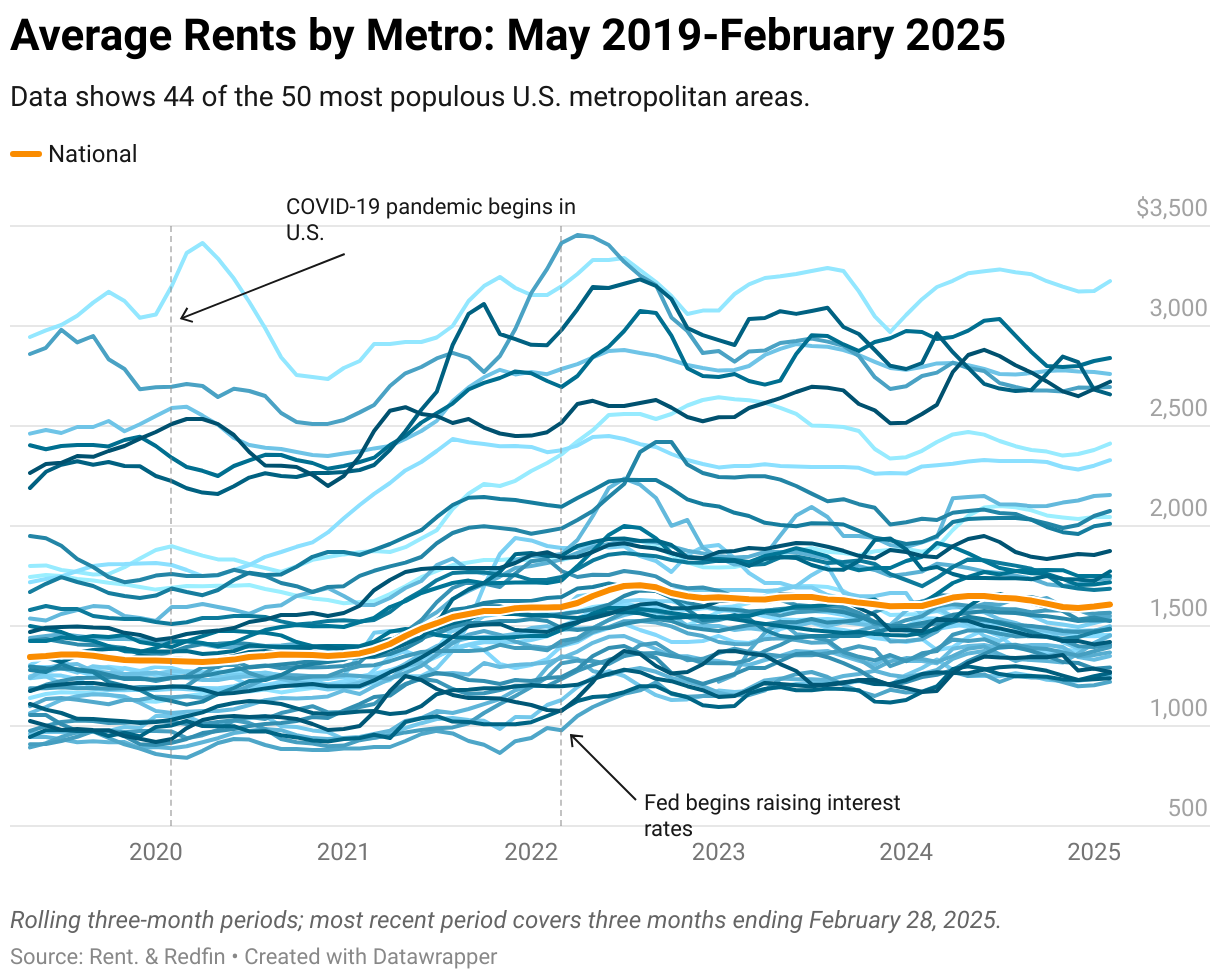
Historical change in rents by metro area
Rent prices have changed significantly since the pandemic, but some metros have seen much larger changes than others.
Rents in San Francisco, for example, have dropped more than 20% from February 2022 to February 2025. On the other end of the spectrum, the typical rent in Providence has climbed 27% in the past five years and shows no sign of slowing.

Complete metro-level data

Methodology
According to a Redfin analysis. Asking rent figures in this report cover newly listed units in buildings with five or more units. The median (what we call “average”) is calculated based on a rolling three-month period. For example, the median asking rent for February 2025 covers rentals that were listed on Rent. and Redfin from December 31, 2024 to February 28, 2025. Data on Rent. market trends pages may differ from data shown in this report.
Metro-level data in this report covers 44 of the 50 most populous U.S. core-based statistical areas (CBSAs). National figures are based on data for the entire U.S.
Asking rents reflect the current costs of new leases. In other words, the amount shown as the median asking rent is not the median of what all renters are paying, but the median asking price of apartments available for rent.


