
Top takeaways from November:
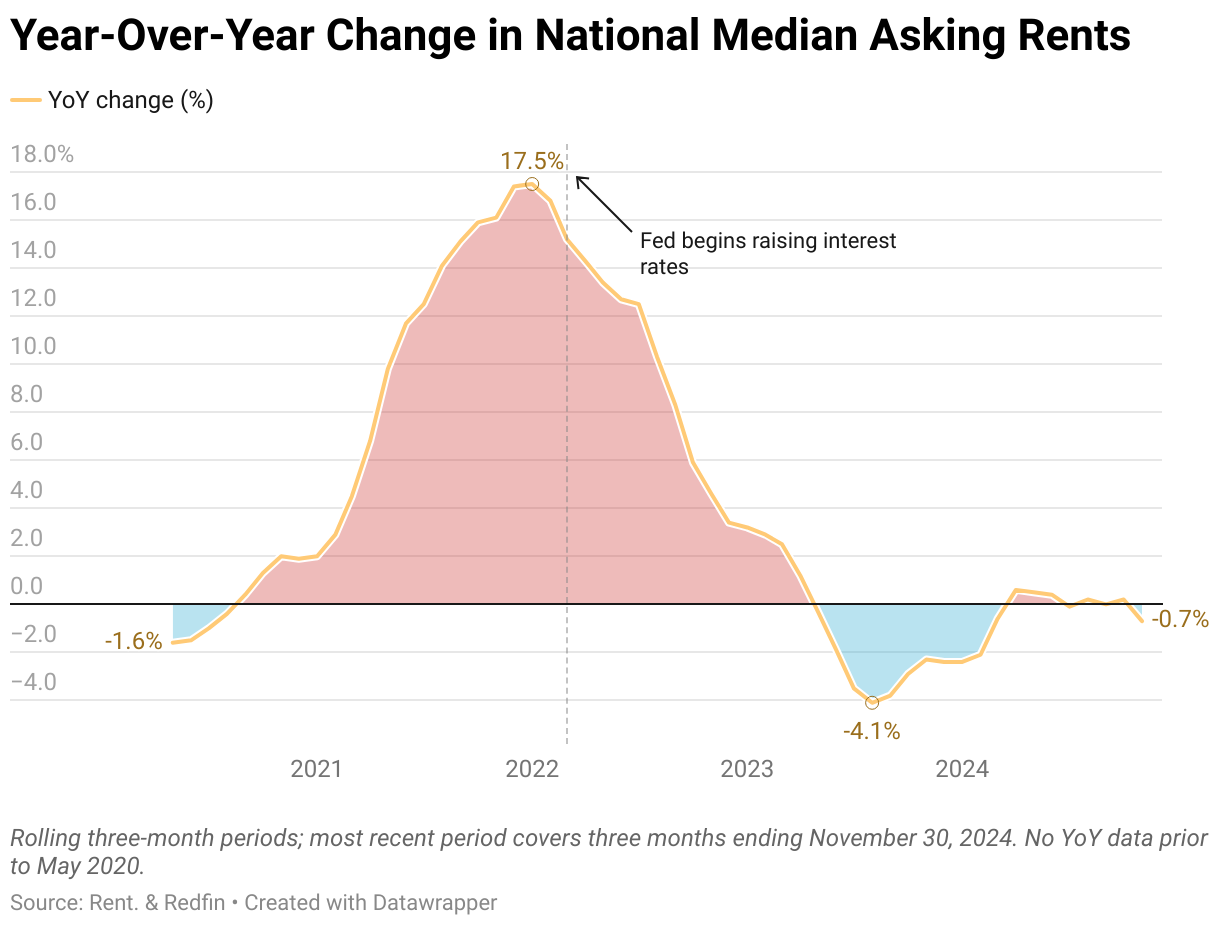
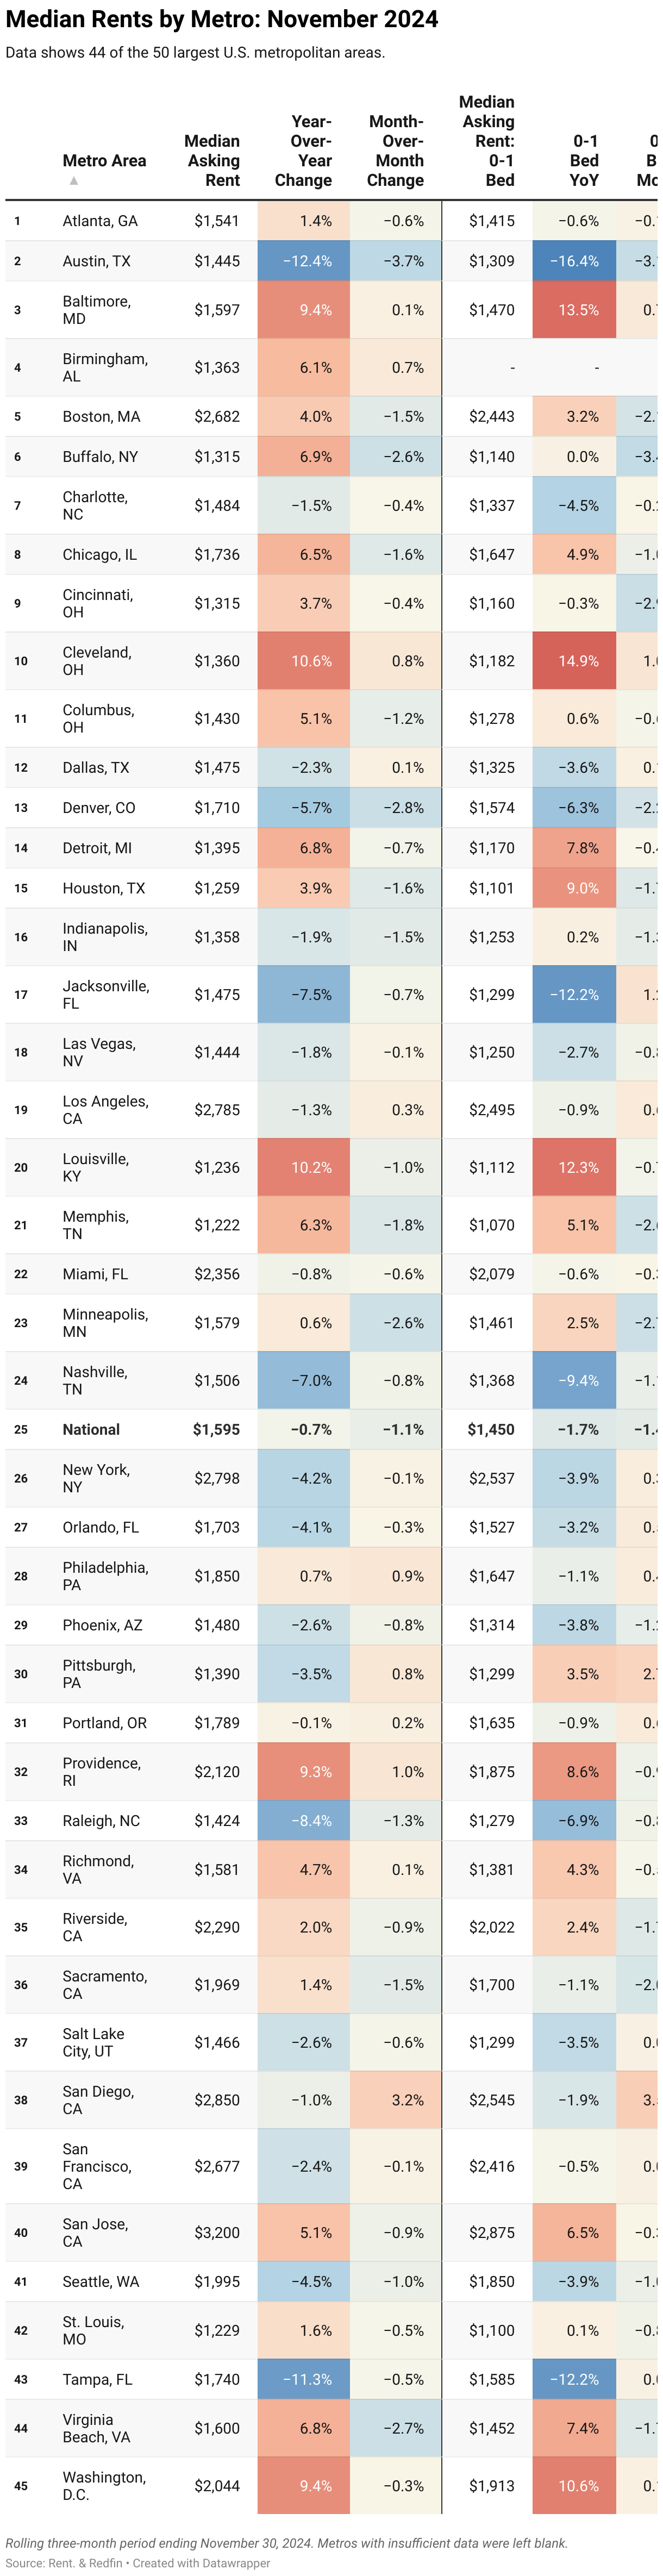
- The median asking rent fell 0.7% year over year in November to $1,595.
- Rents also fell 1.1% ($17) on a monthly basis, down from $1,612 in October.
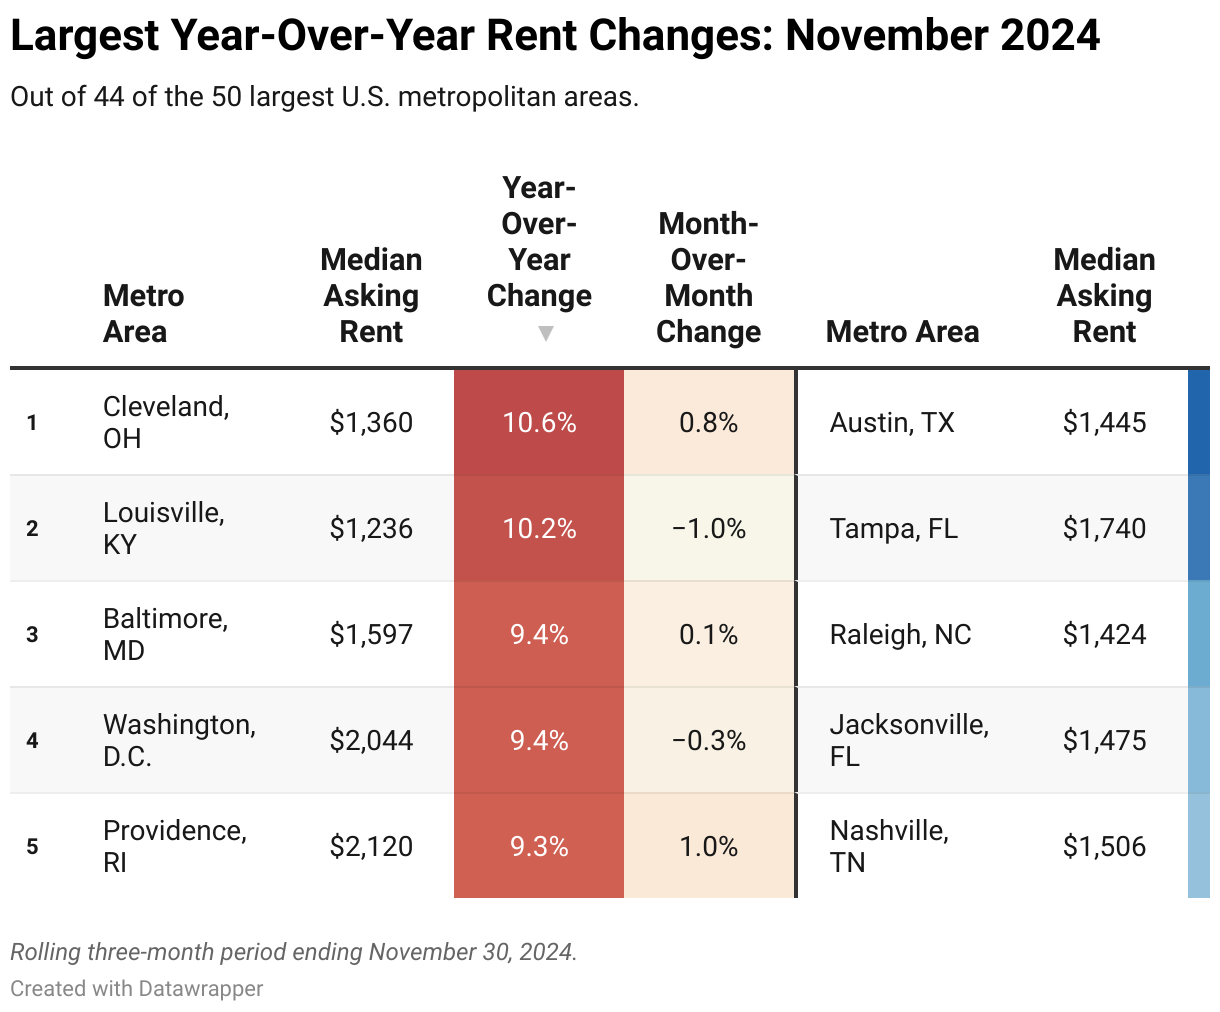
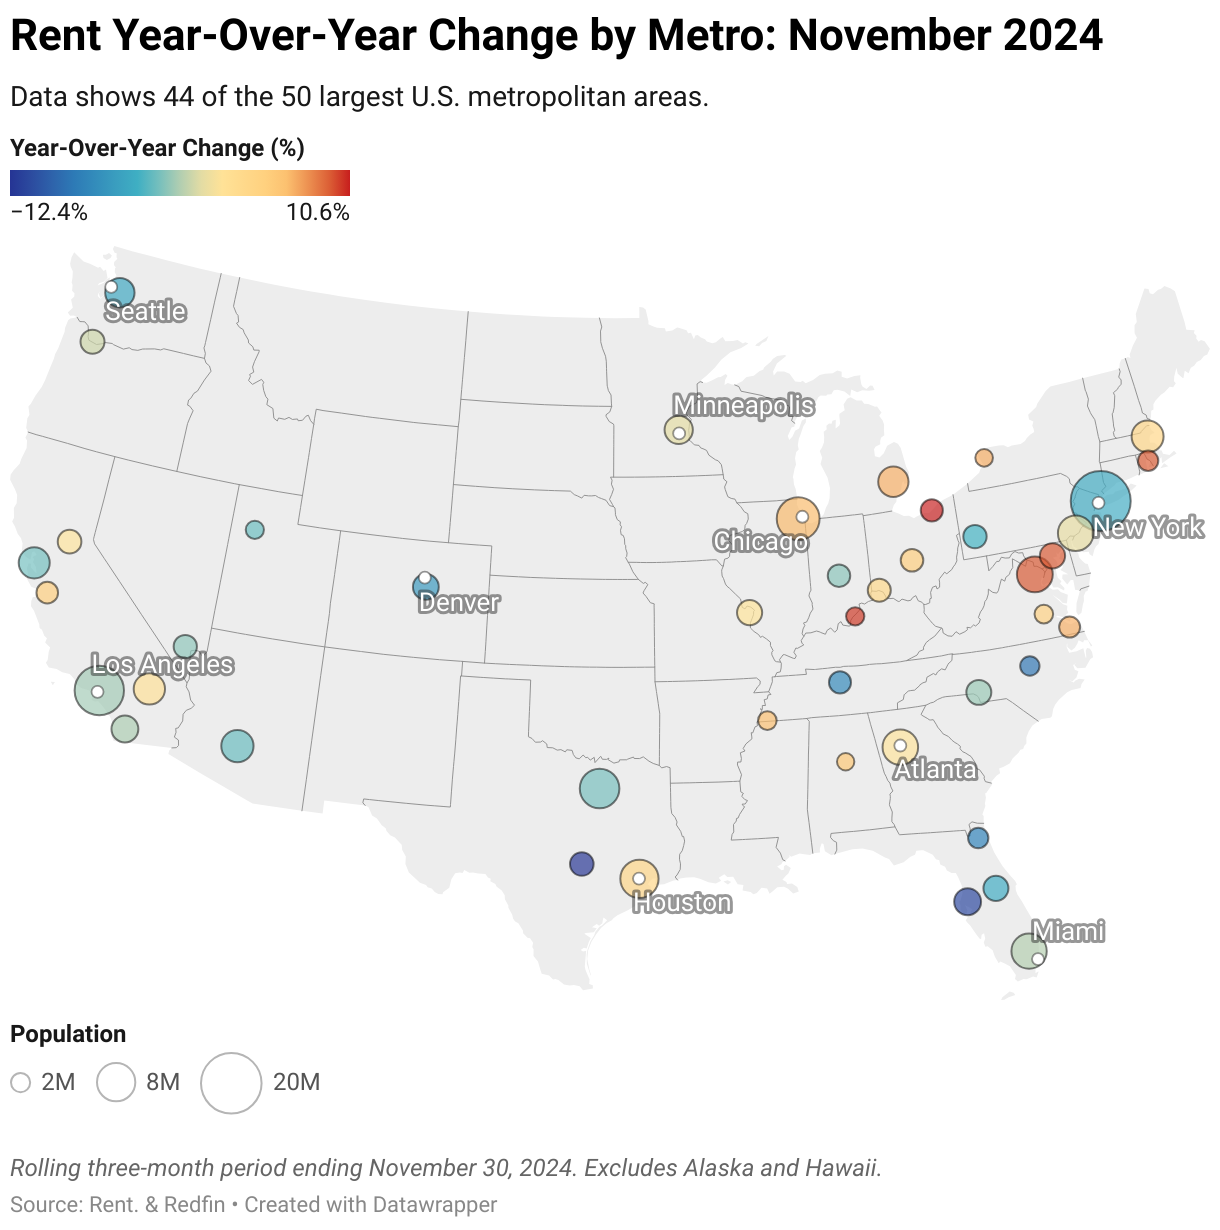
- Cleveland, Louisville, and Baltimore saw the biggest increases; Austin, Tampa, and Raleigh posted the biggest declines.
- 2025 is shaping up to be a renters market, with the affordability gap between buying and renting likely widening.
National rental trends
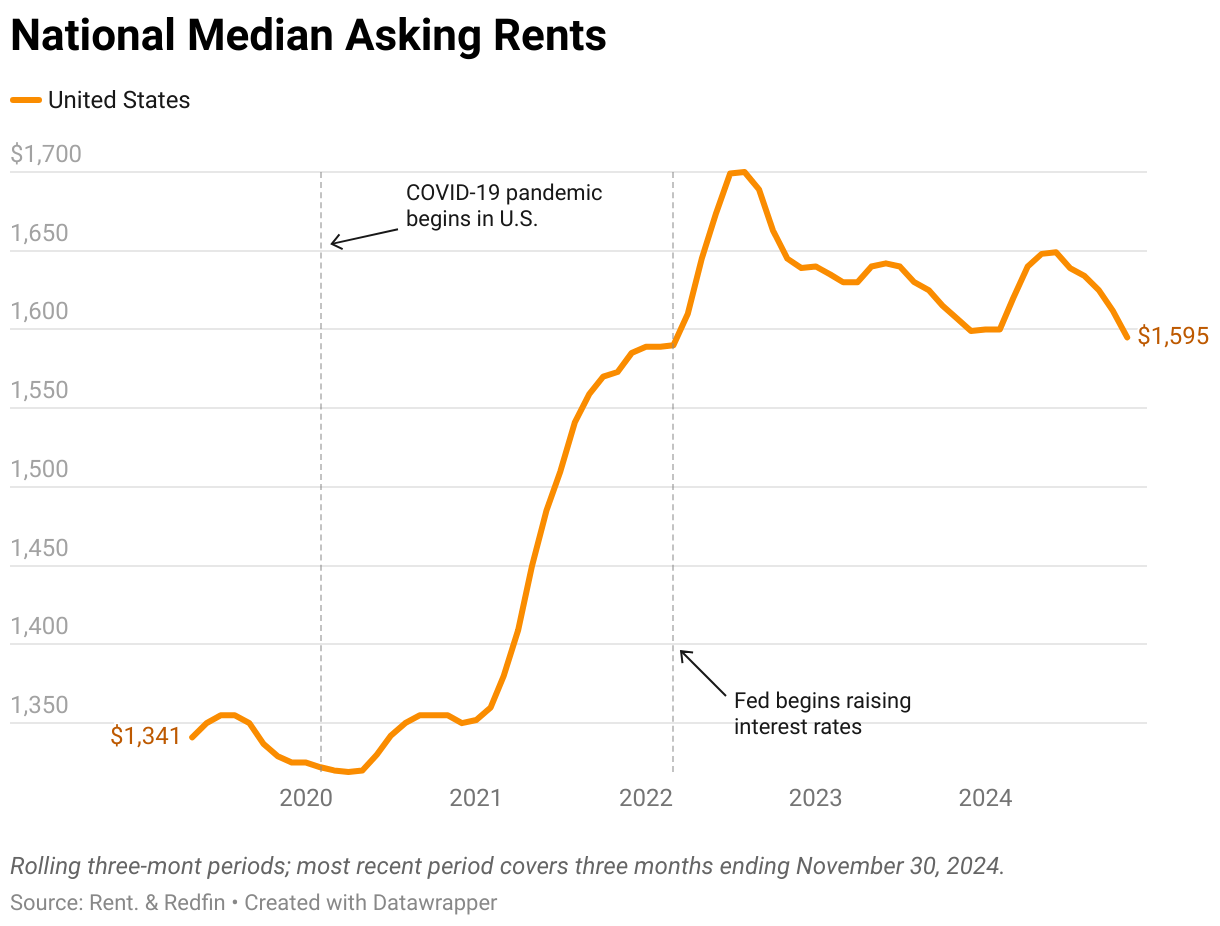
The median U.S. asking rent fell 0.7% year over year in November to $1,595. On a monthly basis, rent prices fell by 1.1%. Rents are now at their lowest level since March 2022.
On average, rents have held steady for the past two years. Prices are now 6.2% below their record high of $1,700 in August 2022.

In some cities, primarily in the Sun Belt, new apartment completions have been at record highs, resulting in an abundance of supply and lower rents. This frenzy has prompted some property managers to offer rent concessions (free parking, free month of rent, etc) to attract prospective tenants. Construction has recently slowed, but a wave of new apartments will still come onto the market in the coming months, which should keep rents down into 2025.
On the other end of the spectrum, cities where apartment construction has been more limited are seeing rents rise. Midwest and East Coast metros like Cleveland and Baltimore are the primary examples.
Demand from young renters and a fast-growing renter population are also contributing factors. In metros like San Jose and Los Angeles, for example, more than half of households are now renters.

Rental trends by bedroom type
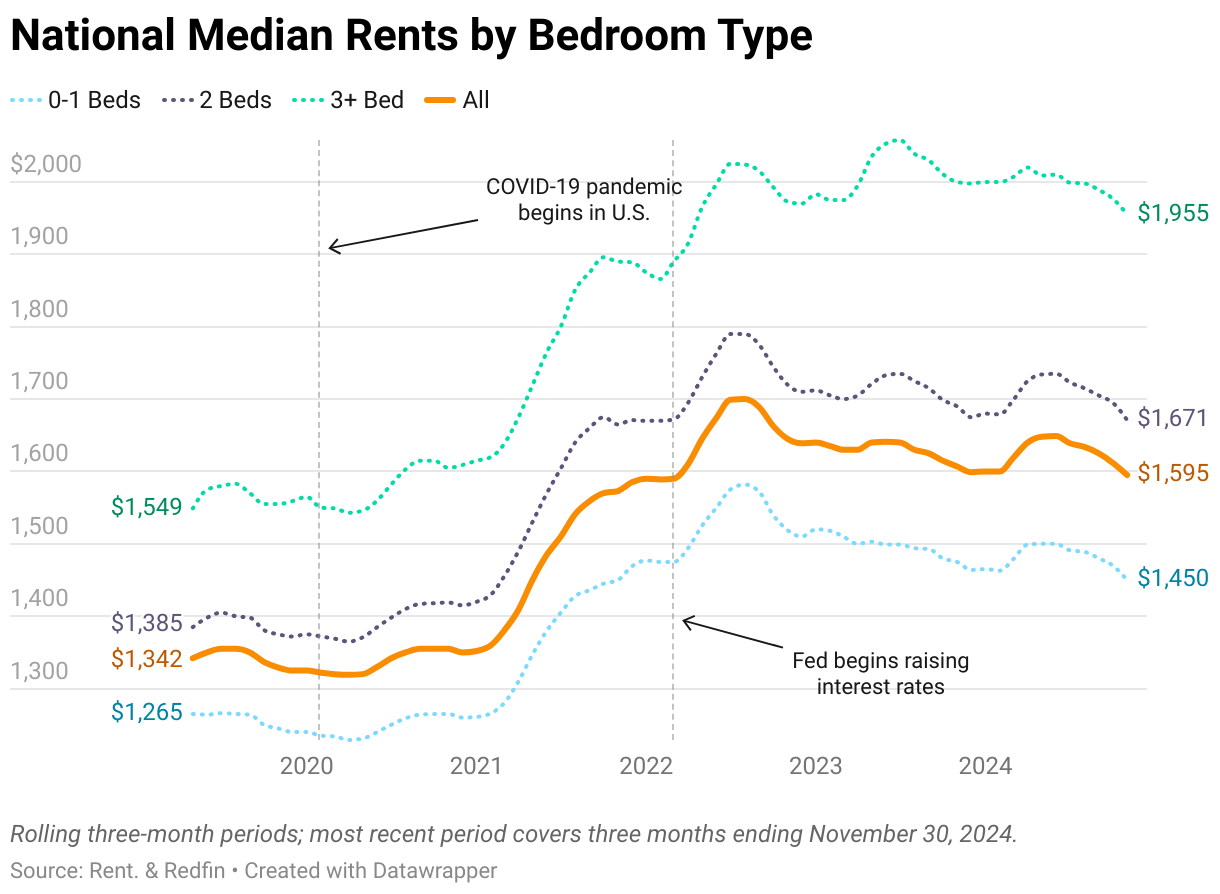
Median rents fell across all bedroom types in November, highlighting how record levels of construction have improved affordability.
- Rents for 0-1-bedroom apartments fell 1.7% YoY to $1,450
- Rents for 2-bedroom apartments fell 1.1% YoY to $1,671
- Rents for 3+-bedroom apartments fell 2.3% YoY to $1,955

Metros with the biggest rent increases and decreases

Rents keep climbing in the Midwest
Several historically affordable Midwest and East Coast metros continue to see steady rent growth, primarily because they haven’t built as many new apartments. This supply/demand imbalance has helped drive rents higher.
Washington, D.C. is unique because rents aren’t particularly affordable, but they’re still rising because construction hasn’t kept up with strong demand in recent years. Demand for lower-priced rentals is especially high.
Prices fall again in the Sun Belt
Similar to past months, rents are falling the most in Sun Belt metros, which built the most apartments since the pandemic in an effort to meet historic demand. Now, they’re faced with an abundance of supply, rising vacancy rates, and a drop in new construction. New apartments are also cheaper than they’ve been in over two years.
Austin again topped the list of the largest rent decreases, continuing its steep decline from pandemic-induced highs. As people leave in droves, apartment supply now far outweighs demand, leading developers to halt construction.
Year-over-year rent changes by metro

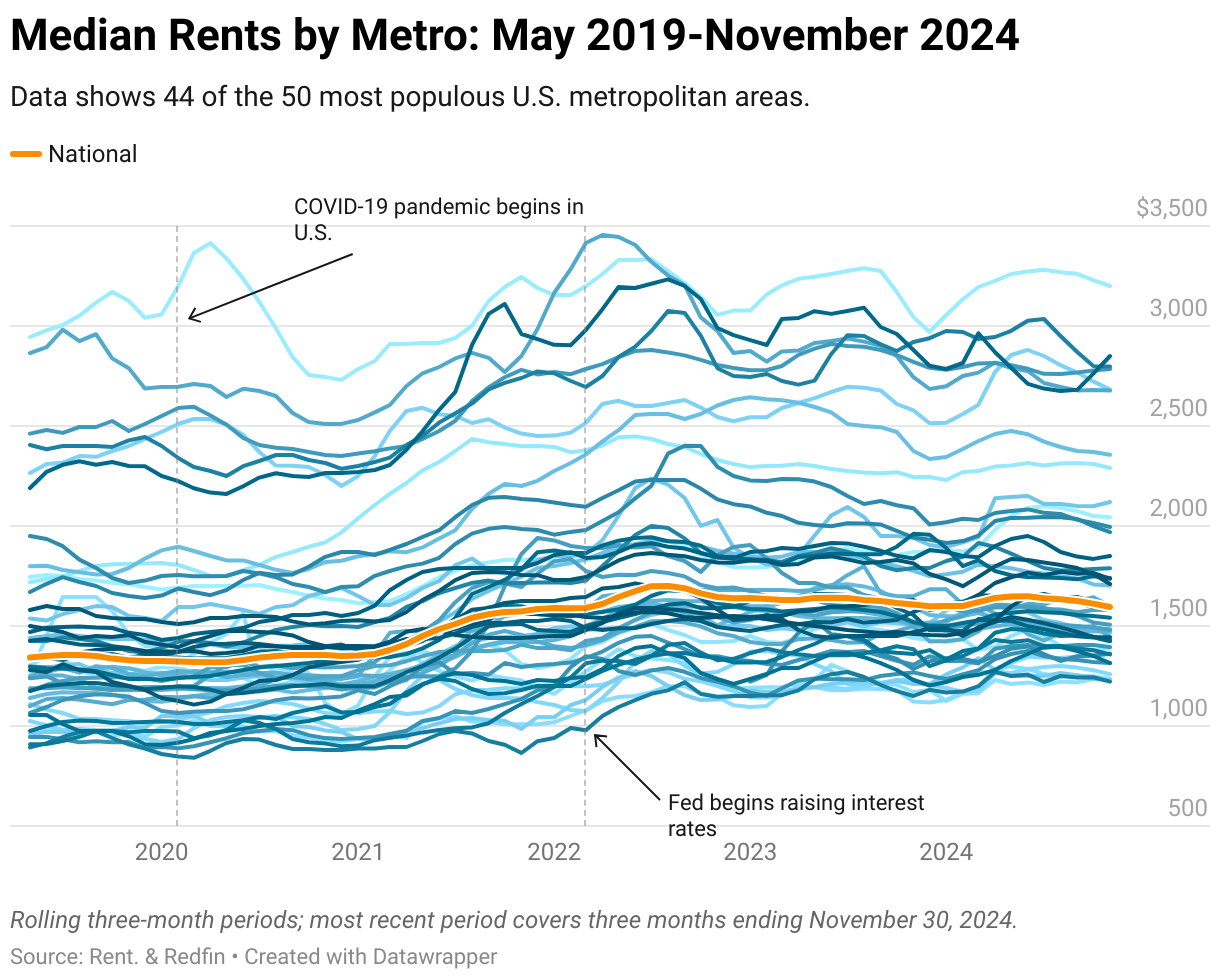
Historical change in rents by metro area
Rent prices have changed significantly since the pandemic, but some metros have seen much larger changes than others.
The median rent in San Francisco, for example, has fallen nearly $800 from a record high of $3,455 in 2022 to $2,677 in November 2024. On the other end of the spectrum, the typical rent in San Diego rose nearly $1,000 in 2021 before leveling out at $2,850 in November 2024. Nashville saw a similar trend.

Complete metro-level data

Methodology
According to a Redfin analysis. Asking rent figures in this report cover newly listed units in buildings with five or more units. The median is calculated based on a rolling three-month period. For example, the median asking rent for November 2024 covers rentals that were listed on Rent. and Redfin during the three months ending November 30, 2024. Data on Rent. market trends pages may differ from data shown in this report.
Metro-level data in this report covers 44 of the 50 most populous U.S. core-based statistical areas (CBSAs). National figures are based on data for the entire U.S.
Asking rents reflect the current costs of new leases. In other words, the amount shown as the median asking rent is not the median of


