
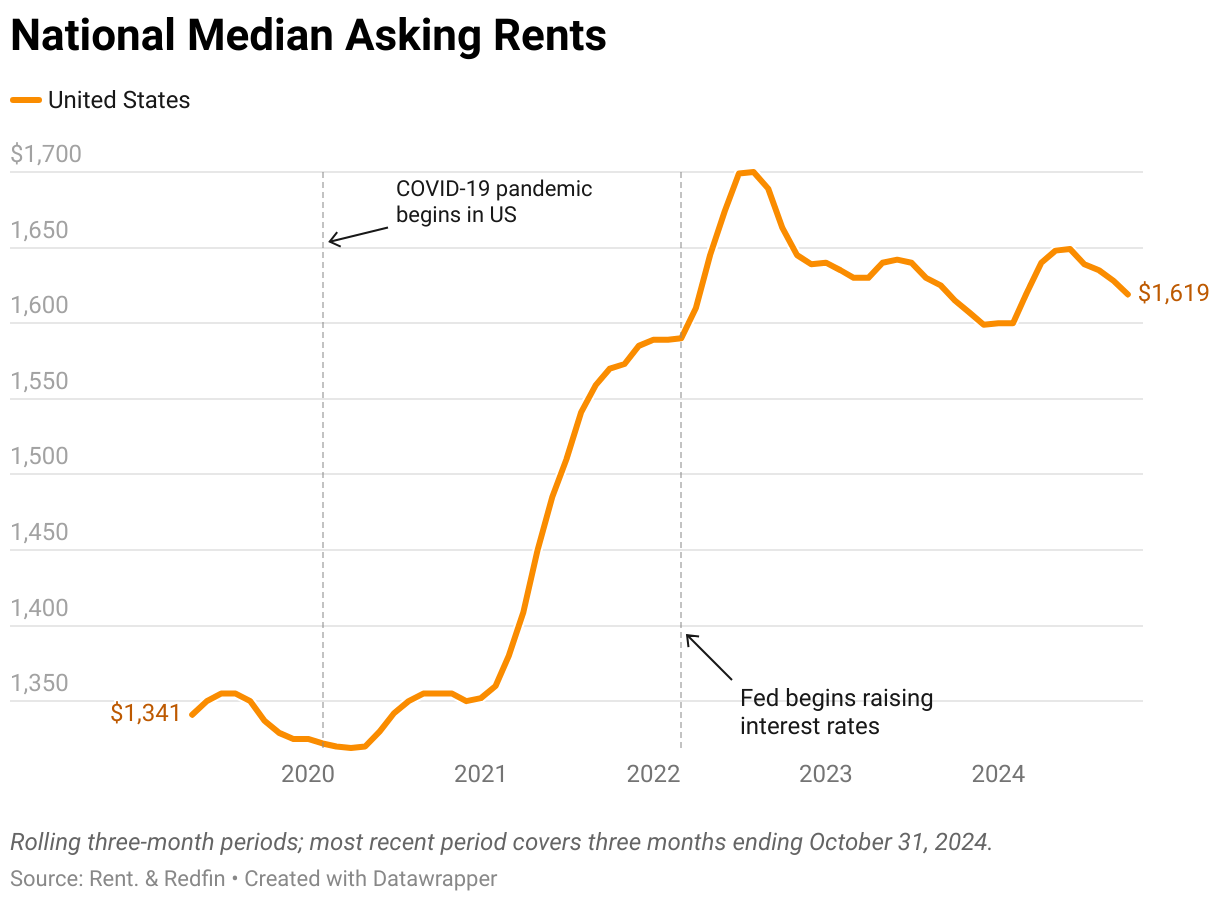
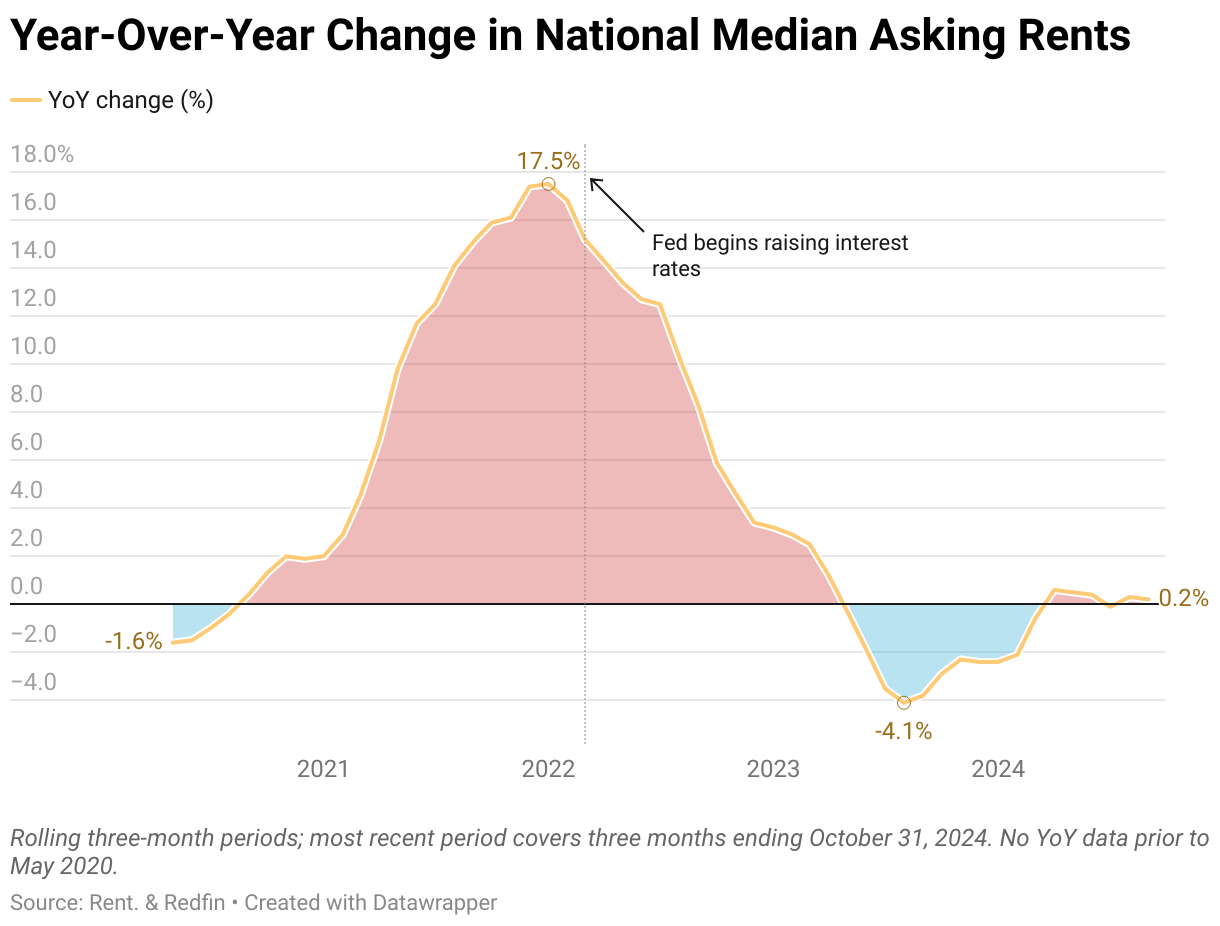
- The U.S. median asking rent rose 0.2% year over year in October to $1,619.
- However, rents actually fell 0.6% ($9) on a monthly basis, down from $1,628 in September.
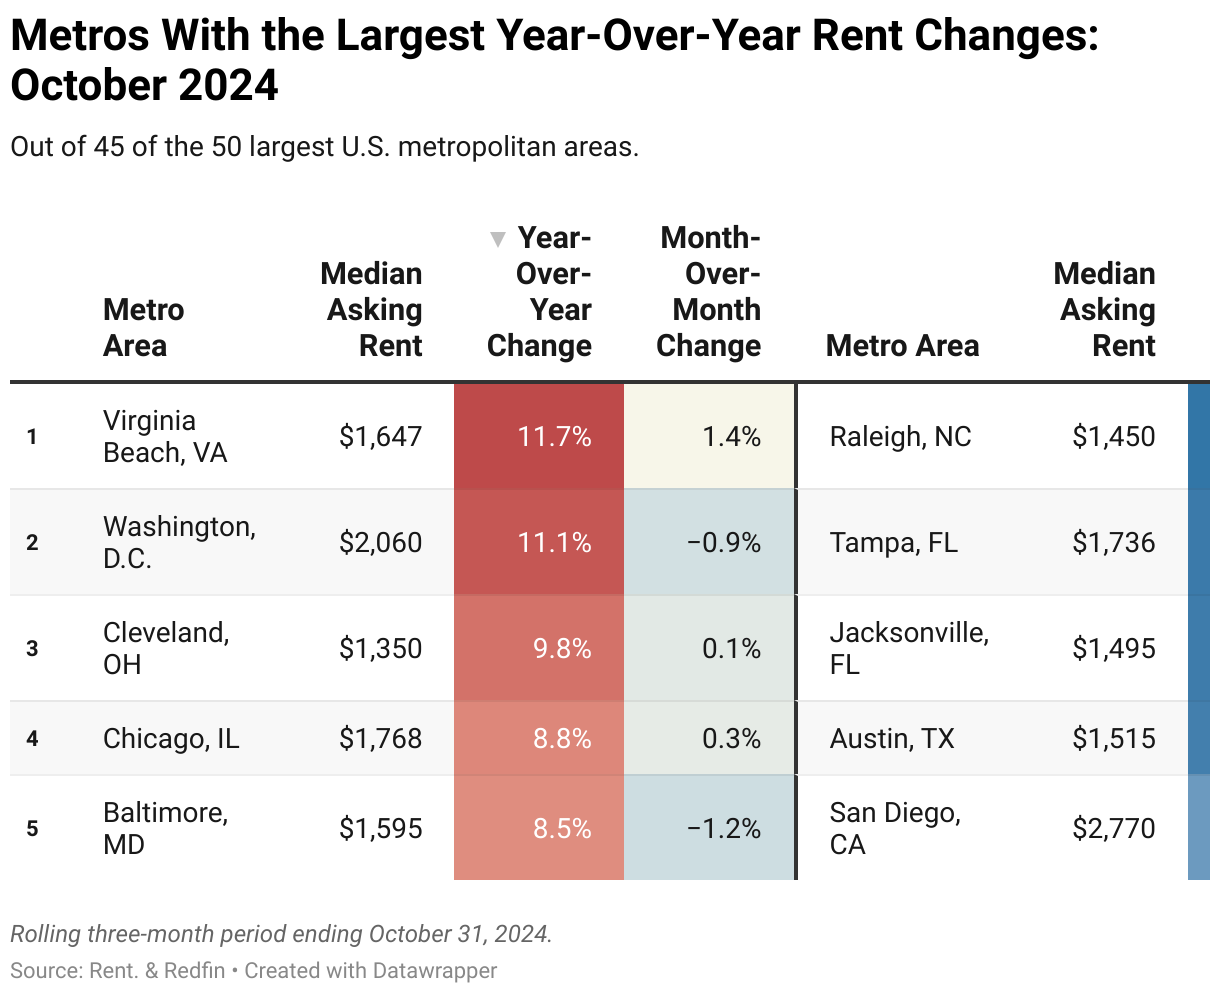
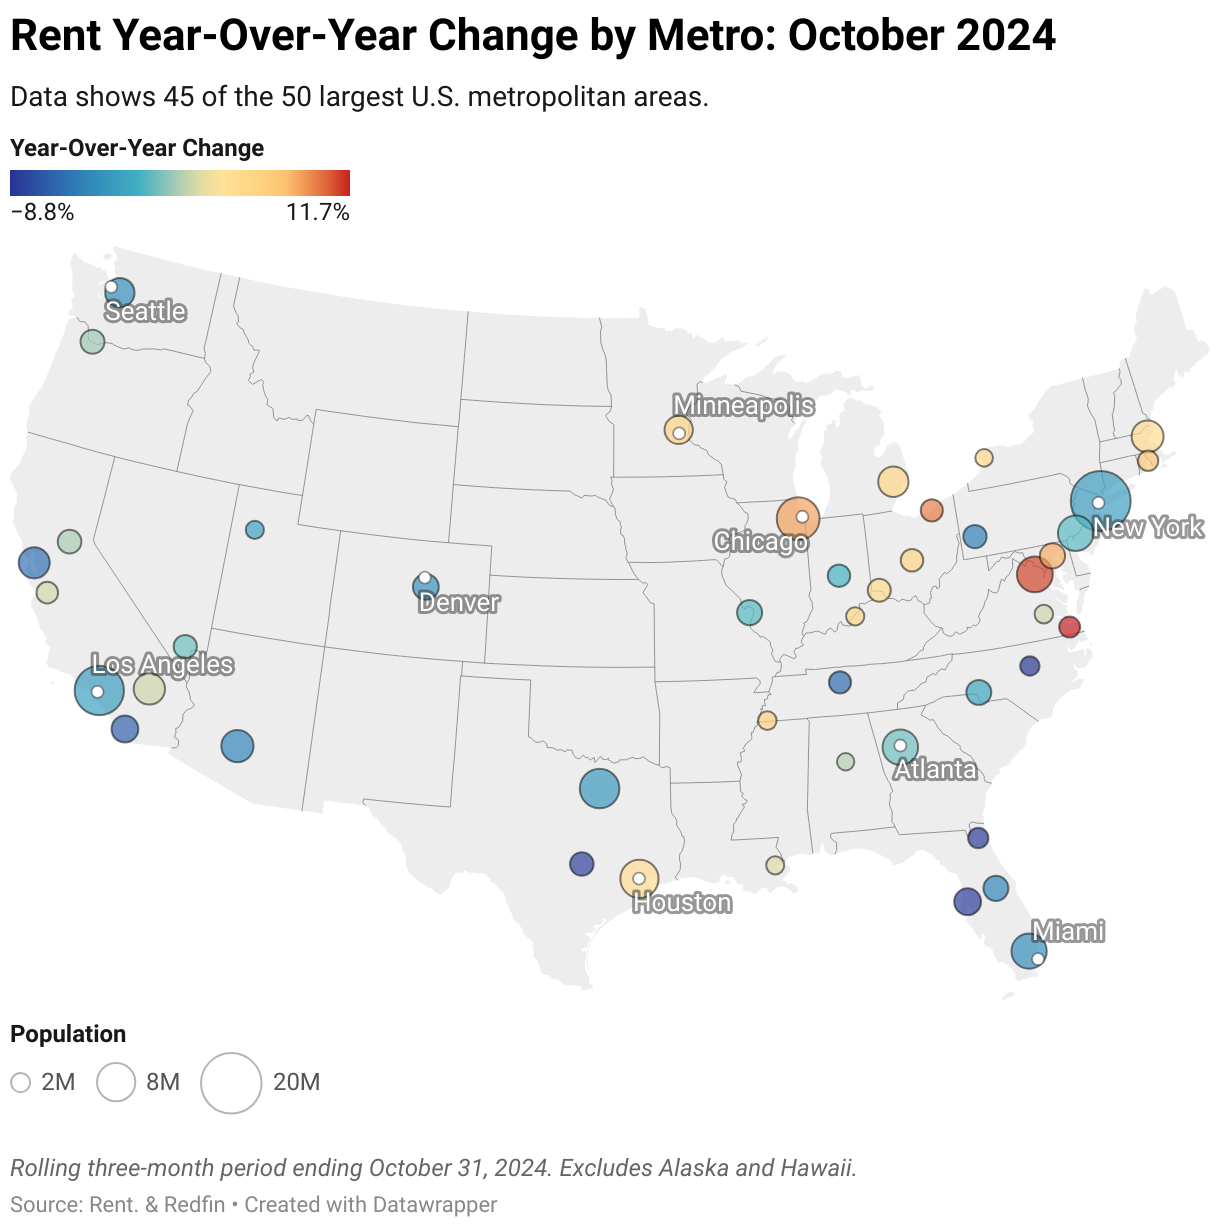
- Virginia Beach, Washington, D.C., and Cleveland saw the biggest increases; Raleigh, Tampa, and Jacksonville posted the biggest decreases.
What’s happening with rents nationwide?
The median U.S. asking rent rose 0.2% year over year in October to $1,619. This is the sixth consecutive increase following 11 months of decreases.
In general, rents have held steady for the past two years since they hit their record high of $1,700 in August 2022. And on a monthly basis, rents actually fell by 0.6% ($9) compared to September.

Rents are holding steady nationally but vary widely depending on where you are in the country. In some areas, especially in the Sun Belt, multifamily building completions have been at record highs, and some metros now have too much supply. This has prompted an uptick in rent concessions from some property managers to attract prospective tenants. Construction is now slowing, but a wave of new apartments will still come onto the market in the next few months, which should keep rents lower.
In other areas, where construction has been more limited, rents are rising. Demand from young renters and a fast-growing renter population are also contributing factors. In metros like San Jose and Los Angeles, for example, more than half of households are renters.

Rental breakout by bedroom type
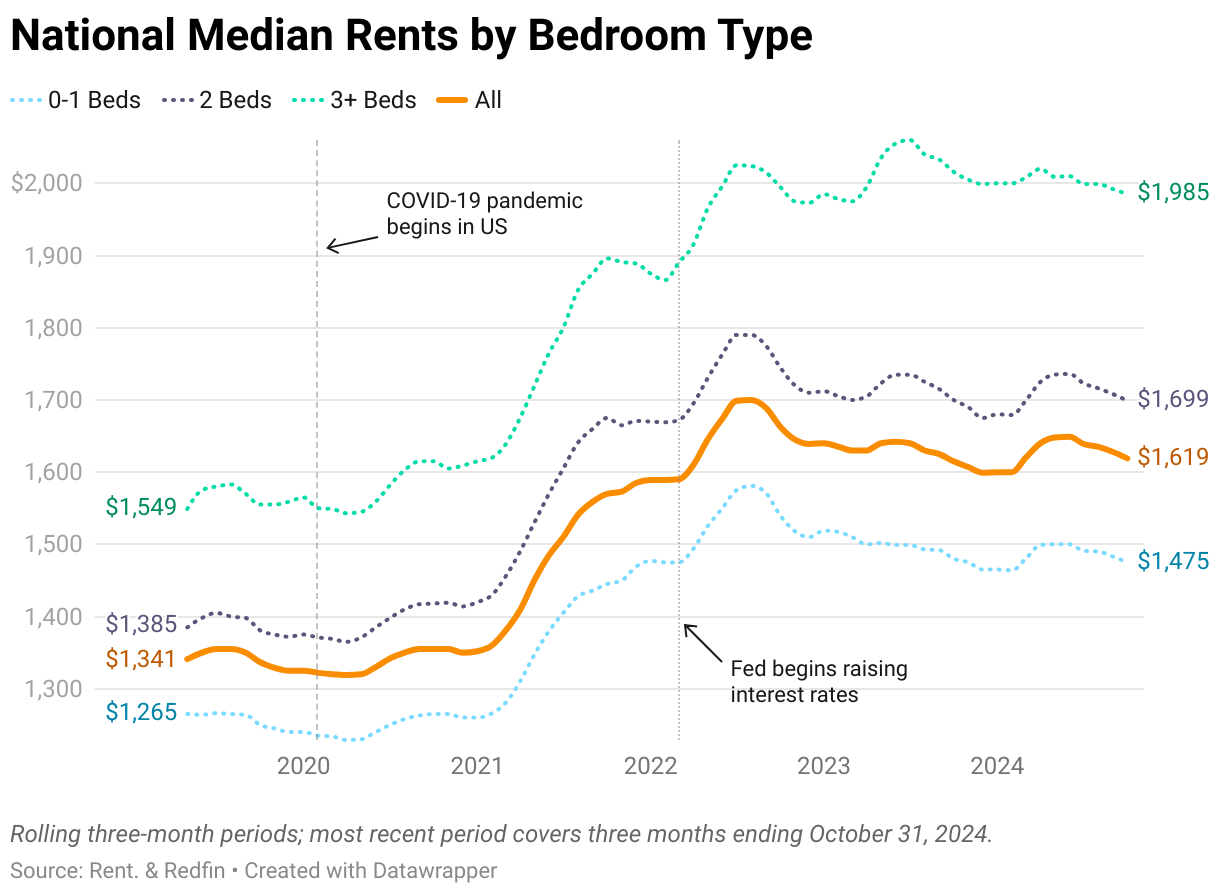
When looking at all bedroom types combined, rents rose slightly year over year. However, when isolating by bedroom type, rents actually fell for the third month in a row:
- Rents for 0-1-bedroom apartments fell 0.4% YoY to $1,475
- Rents for 2-bedroom apartments fell 0.1% to $1,699
- Rents for 3+-bedroom apartments fell 1.5% YoY to $1,985
It may seem odd that rents rose when looking at all bedroom types combined but fell when isolating by bedroom type. This is due to the statistal phenomenon known as Simpson’s paradox, where trends that appear in groups of data may disappear or reverse when looking at the data as a whole.

U.S. metros where rents are rising and falling

Why are rents rising in these metros?
Several historically affordable Midwest and East Coast metros continue to see steady rent growth, primarily they haven’t built as many new apartments. This supply-demand imbalance has helped drive rents higher.
Washington, D.C. is unique because rents aren’t particularly affordable, but they’re still rising because construction hasn’t kept up with strong demand in recent years. Demand for lower-priced rentals is especially high.
Why are rents falling in these metros?
Rents are falling in several Sun Belt metros, which built the most apartments since the pandemic in an effort to meet booming demand. Now, they’re faced with an abundance of supply, a rise in unfilled apartments, and a drop in new construction. Asking rents for new apartments are also lower than they have been in over two years.
This trend has been most obvious in Austin, which experienced a wave of migration during the pandemic and ramped up construction to meet demand. Now, as people leave in droves, apartment supply outweighs demand. Austin also led the nation in year-over-year rent drops from June to August this year.
Year-over-year change by metro

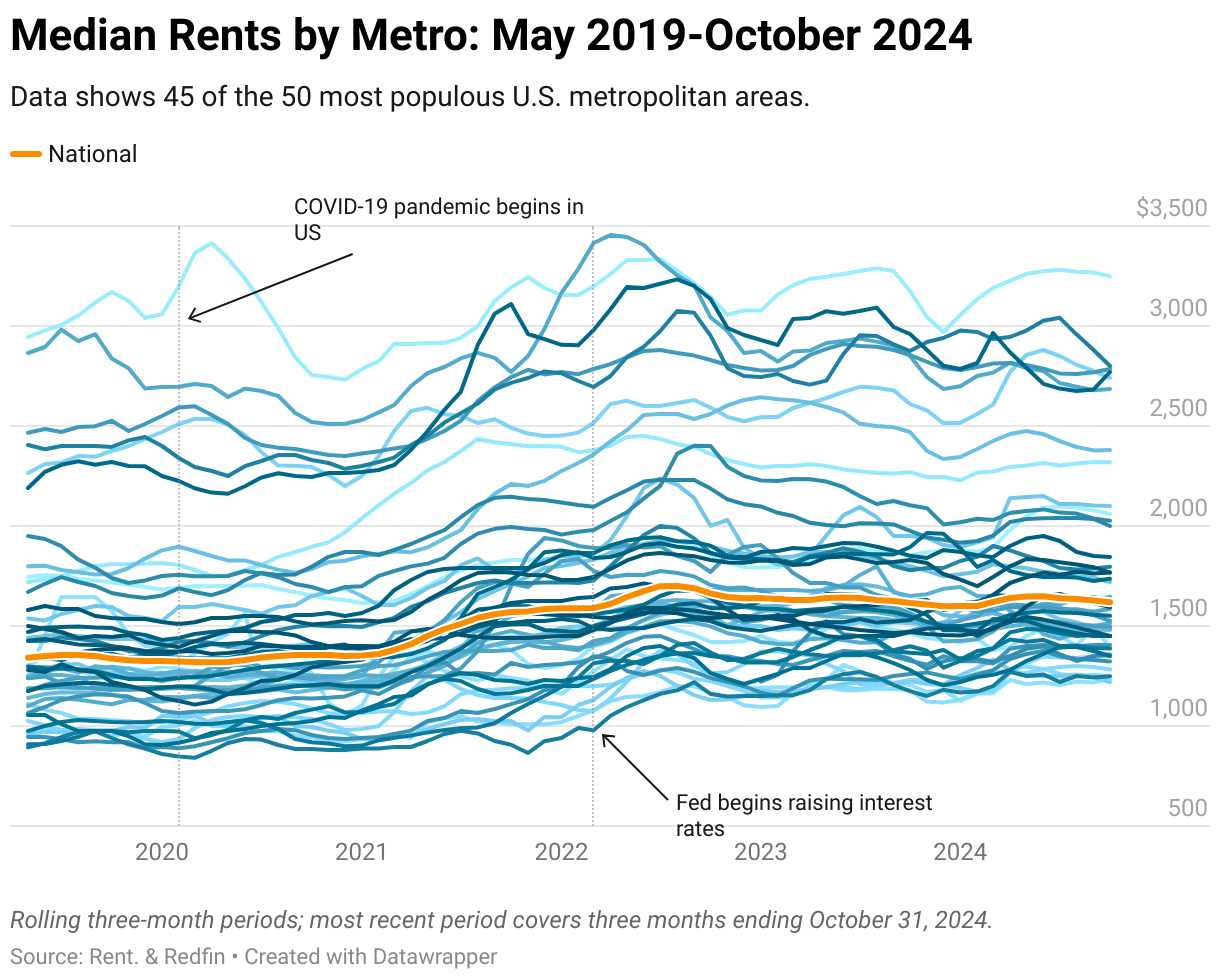
Historical change in median rents by metro area
Rents have changed significantly since the pandemic, but some metros have seen much larger fluctuations than others.
San Francisco, for example, has fallen nearly $800 from a record high of $3,455 in 2022 to $2,685 in October 2024. On the other end of the spectrum, San Diego rose over $1,000 from $2,190 to $3,233 in just over a year, before leveling out at $2,770 in October 2024. Nashville saw a similar trend.

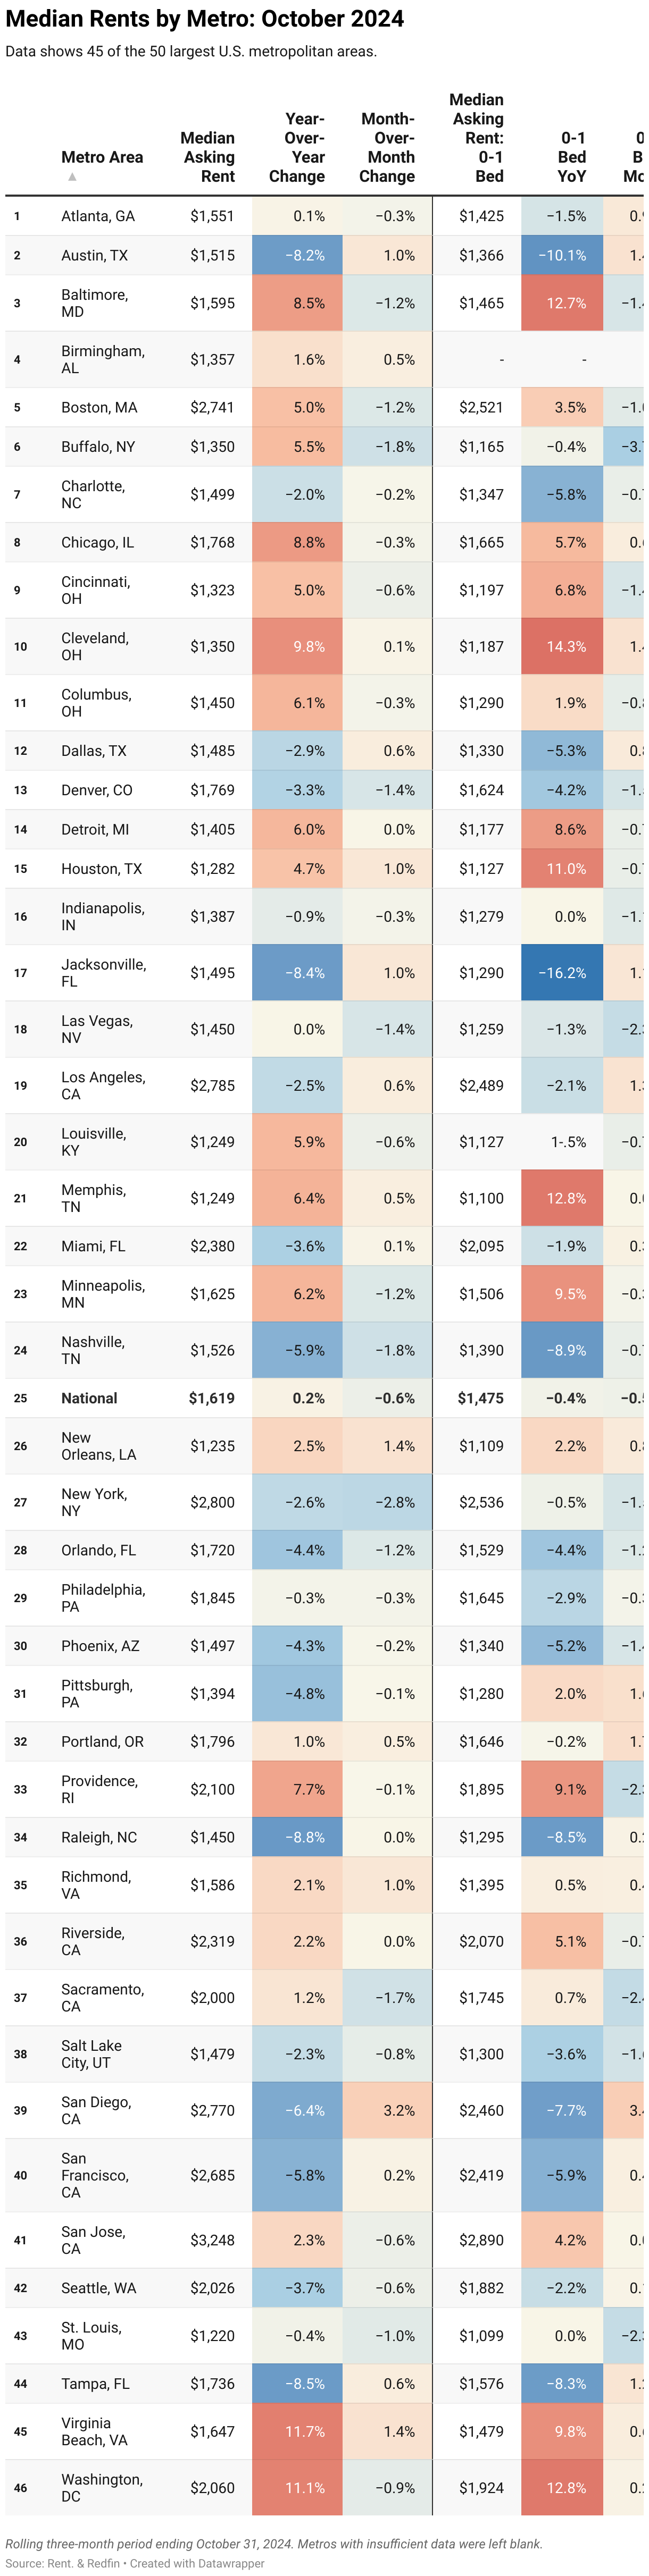
October 2024: Complete median metro-level data

Methodology
According to a Redfin analysis. Asking rent figures in this report cover newly listed units in buildings with five or more units. The median is calculated based on a rolling three-month period. For example, the median asking rent for October 2024 covers rentals that were listed on Rent. and Redfin during the three months ending October 31, 2024. Data on Rent. market trends pages may differ from data shown in this report.
Metro-level data in this report covers 45 of the 50 most populous U.S. core-based statistical areas (CBSAs). National figures are based on data for the entire U.S.
Asking rents reflect the current costs of new leases. In other words, the amount shown as the median asking rent is not the median of what all renters are paying, but the median asking price of apartments available for rent.


