
Rent has risen in almost every state, spurred by a series of events over the last two years. Vacancy rates hit a 37-year low during the final quarter of 2021, according to the U.S. Census Bureau. A historically competitive housing market, rising inflation and widespread food insecurity prompted many renters to stay in their homes instead of risking higher rents elsewhere.
In fact, The Pew Research Center noted that just 8 percent of Americans moved between March 2020 and March 2021. This limited inventory even more and nudged rent prices higher.
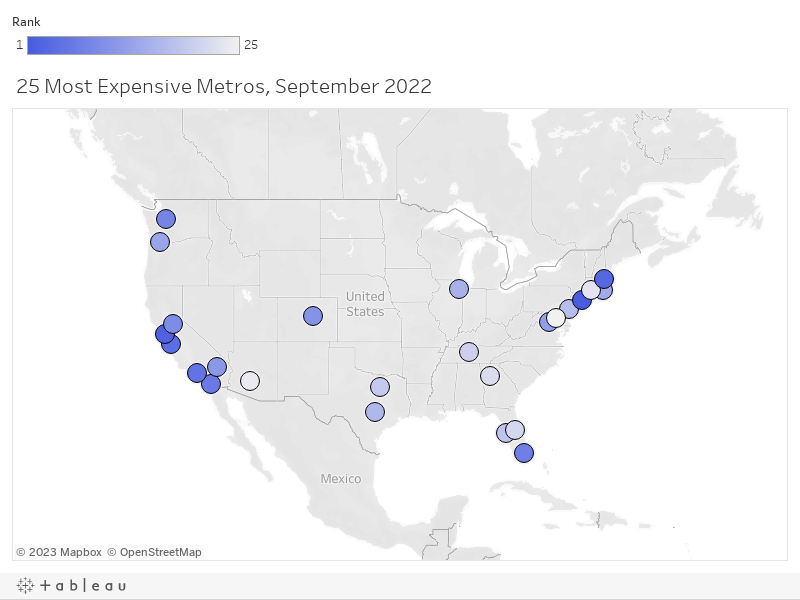
The most expensive metros in the U.S. aren’t evenly distributed. Instead, the 10 most expensive places for renters are mostly in the western part of the country and in major metropolitan areas in the south and northeast.
The survey
Our survey details the average price per apartment between September 2021 and September 2022. It also contains the difference in rent prices between August and September 2022.

The top 3 most expensive metros in the U.S.
Renters in the New York–Newark–Jersey City metro paid the highest rent prices during this survey period — $4,176. That’s up 1 percent from the previous month, but 15.3 percent higher than the year before. It’s also the highest year-over-year increase of the top 10 most expensive metros.
High prices in this community are nothing new. New York topped the list of the most expensive cities in the U.S. in August 2022. And, the cost of living in Manhattan was 153.5 percent more expensive than the national average.
With an average monthly rent of $3,807, the San Francisco–Oakland–Berkeley metropolitan area comes in second on the list of most expensive metros in the United States. Rents actually decreased by 2.8 percent here in September. But, prices still rose 9.9 percent year over year.
The Boston–Cambridge–Newton metro is the third most expensive in the country. Rents here averaged $3,730.50 monthly in September 2022. Rents dipped 1.5 percent from the previous month. But, prices held relatively steady year over year, increasing just 1.1 percent.
The remaining most expensive metros in the country
The No. 4, No. 5 and No. 6 most expensive metros in the country are in California. The metropolitan area that contains San Jose, Sunnyvale and Santa Clara is the fourth most expensive in the nation. The average rent here is $3,611, a decrease of 1.8 percent since August 2022, but up 6.2 percent year over year.
September rent was 3.5 percent cheaper than the month before in the Los Angeles–Long Beach–Anaheim metro. But it increased by 1.1 percent over the previous year, landing at an average of $3,468.75 per month by September 2022.
That’s just a few dollars more than rent in the San Diego–Chula Vista–Carlsbad metro, where September rents averaged $3,440.50 during the same survey period. That reflects a tiny uptick (.23 percent) from August to September. But, that minuscule cost increase came as a relief to renters who have seen rent prices increase 9.5 percent in the community since last year.
Monthly rent is about $400 cheaper ($3,080) in the Miami–Fort Lauderdale–Pompano Beach metropolitan area. Rents there increased 1.7 percent month over month and 7.3 percent from the previous year. Uncertainties within Florida’s homeowners’ insurance market in the aftermath of Hurricane Ian mean experts are watching the state’s housing situation closely.
Washington enters the list as the Seattle–Tacoma–Bellevue community clocks in at No. 8. The average rent, $2,971, is down 1.5 percent from the previous month, but up 3 percent over last year’s numbers.
Rent costs $2,774 in the Sacramento–Roseville–Folsom metro area. Rent increased 5.3 percent year over year in this California community. But, rents rose just 0.5 percent since August.
The mile-high metropolitan area that contains the cities of Denver, Aurora and Lakewood rounds out the Top 10 most expensive metros in the country. The average rent in this Colorado community is $2,752. That’s up just 1.7 from the previous month but an increase of 9.7 percent over the last year. The Denver Post says experts don’t anticipate a return to more stable rent prices until 2023.
The takeaway
The cost of rent is likely to continue to rise in the most expensive metro and across the country, at least through the end of 2022. Prices may not stabilize until 2023.
| Rank | Metro | Population | Median Rent | MoM % Change | YoY % Change |
|---|---|---|---|---|---|
| 1 | New York-Newark-Jersey City, NY-NJ-PA CBSA | 19,768,458 | $4,176 | 0.68% | 15.38% |
| 2 | San Francisco-Oakland-Berkeley, CA CBSA | 4,623,264 | $3,807 | -2.79% | 9.89% |
| 3 | Boston-Cambridge-Newton, MA-NH CBSA | 4,899,932 | $3,731 | -1.46% | 1.12% |
| 4 | San Jose-Sunnyvale-Santa Clara, CA CBSA | 1,952,185 | $3,611 | -1.83% | 6.21% |
| 5 | Los Angeles-Long Beach-Anaheim, CA CBSA | 12,997,353 | $3,469 | -3.55% | 1.14% |
| 6 | San Diego-Chula Vista-Carlsbad, CA CBSA | 3,286,069 | $3,441 | 0.23% | 9.54% |
| 7 | Miami-Fort Lauderdale-Pompano Beach, FL CBSA | 6,091,747 | $3,080 | 1.71% | 7.28% |
| 8 | Seattle-Tacoma-Bellevue, WA CBSA | 4,011,553 | $2,972 | -1.48% | 3.03% |
| 9 | Sacramento-Roseville-Folsom, CA CBSA | 2,411,428 | $2,774 | 0.53% | 5.26% |
| 10 | Denver-Aurora-Lakewood, CO CBSA | 2,972,566 | $2,752 | 1.65% | 9.73% |
| 11 | Riverside-San Bernardino-Ontario, CA CBSA | 4,653,105 | $2,724 | -0.62% | 2.88% |
| 12 | Washington-Arlington-Alexandria, DC-VA-MD-WV CBSA | 6,356,434 | $2,706 | -1.97% | 6.71% |
| 13 | Portland-Vancouver-Hillsboro, OR-WA CBSA | 2,511,612 | $2,602 | -0.50% | 14.00% |
| 14 | Providence-Warwick, RI-MA CBSA | 1,675,774 | $2,524 | -0.47% | 7.33% |
| 15 | Chicago-Naperville-Elgin, IL-IN-WI CBSA | 9,509,934 | $2,437 | -0.98% | -0.49% |
| 16 | Austin-Round Rock-Georgetown, TX CBSA | 2,352,426 | $2,395 | 1.86% | 8.88% |
| 17 | Philadelphia-Camden-Wilmington, PA-NJ-DE-MD CBSA | 6,228,601 | $2,334 | -2.41% | 4.42% |
| 18 | Tampa-St. Petersburg-Clearwater, FL CBSA | 3,219,514 | $2,173 | -0.46% | 4.11% |
| 19 | Dallas-Fort Worth-Arlington, TX CBSA | 7,759,615 | $2,157 | -0.06% | 8.84% |
| 20 | Nashville-Davidson–Murfreesboro–Franklin, TN CBSA | 2,012,476 | $2,127 | -0.74% | 17.03% |
| 21 | Orlando-Kissimmee-Sanford, FL CBSA | 2,691,925 | $2,121 | -1.51% | 4.24% |
| 22 | Atlanta-Sandy Springs-Alpharetta, GA CBSA | 6,144,050 | $2,084 | -0.29% | 2.70% |
| 23 | Hartford-East Hartford-Middletown, CT CBSA | 1,211,906 | $2,076 | 1.39% | 5.15% |
| 24 | Phoenix-Mesa-Chandler, AZ CBSA | 4,946,145 | $2,043 | -0.64% | 1.77% |
| 25 | Baltimore-Columbia-Towson, MD CBSA | 2,838,327 | $2,041 | -1.93% | -2.84% |
Methodology
We analyzed rental property prices in September 2022, the last full month of data, from Rent.’s available inventory to identify our median rent prices at the national, state and metro levels. Our analysis combines inventory and bedroom types into one simple median that covers all available rental units at the time.
The top 50 metropolitan areas in our analysis are determined by U.S. Census Bureau population estimates for 2021.
More detailed information about our methodology can be found here.
The rent information included in this article is used for illustrative purposes only. The data contained herein do not constitute financial advice or a pricing guarantee for any apartment.


